
Welcome, dear user of Relevant Yield, to the first release after the New Year!
During the last month, we have had a lot to do around our templates. We are really happy with this significant update, and I am sure that you will find several of the (many!) items we are launching very useful.
- Build and add your own templates editor
- New set of official templates
- Dynamic metric ordering in tables
- Last 3 months vs previous 3 months - a change!
- Google Chrome cookie 1% deprecation - new dimension & template
The release will be made available today and throughout the rest of the week.
1. Build and add your own templates editor
We are really happy to launch our new template editor, and make it available for you to work with. As you might know, we always strive to give publishers as much control and customizability as we can through our tool, and the template editor fits that mold perfectly.
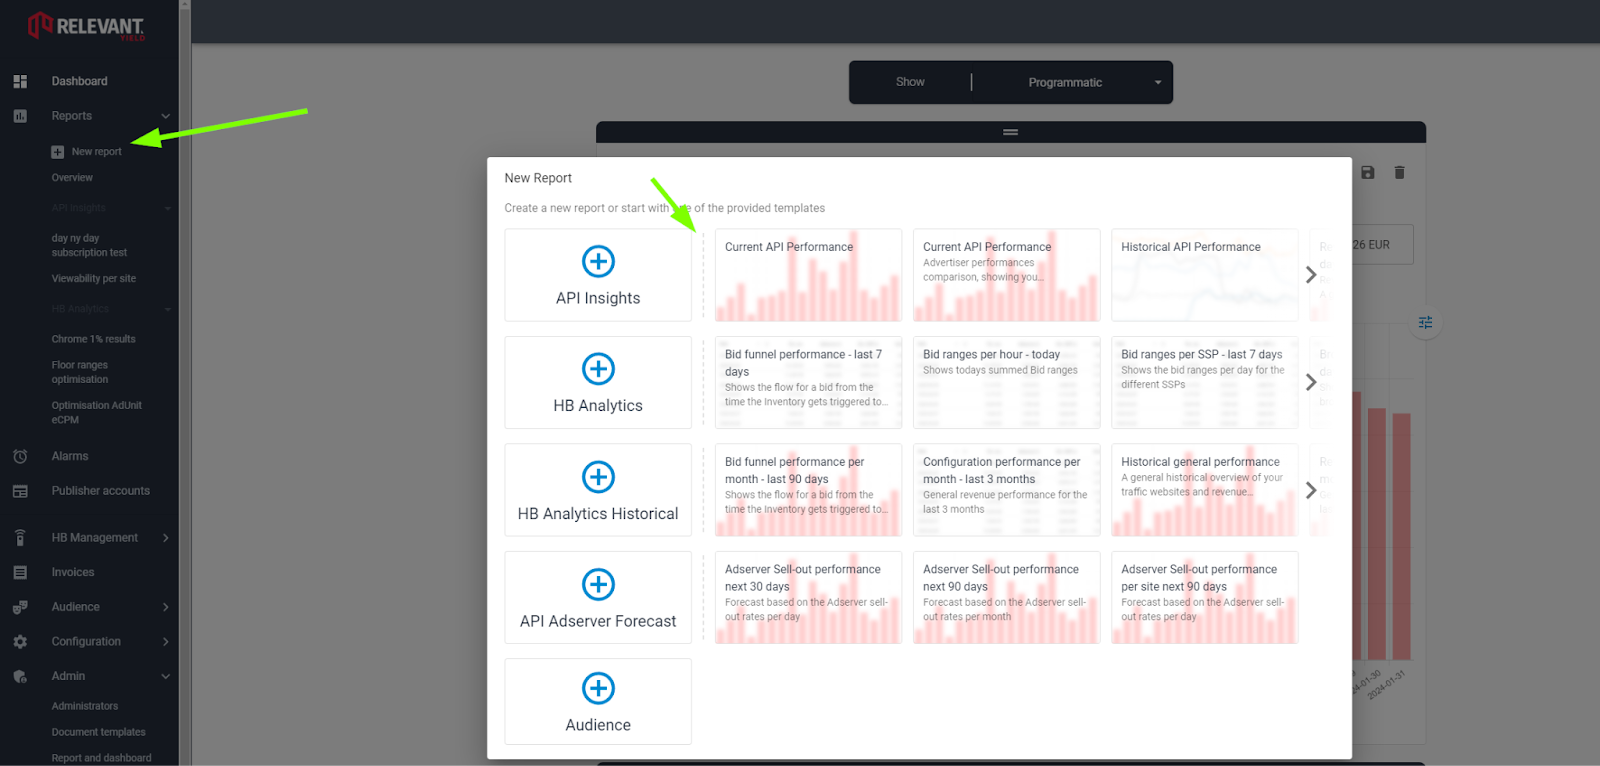
Simply go into the admin menu item on the left, and we have added a new section called “report and dashboard templates”:
With the template editor you can:
- Build your own new templates
- Build templates for the other admins
- Turn reports or dashboard widgets into templates that you or the rest of the team can use
- Build templates for your publisher/sales users
- Save reports into templates
- Save dashboard widgets into templates
- Add descriptions to your new templates
- Select which users should have access to a specific template
Please, notice that we will continue to produce new official templates, and we do have a few really good new ones included here also.
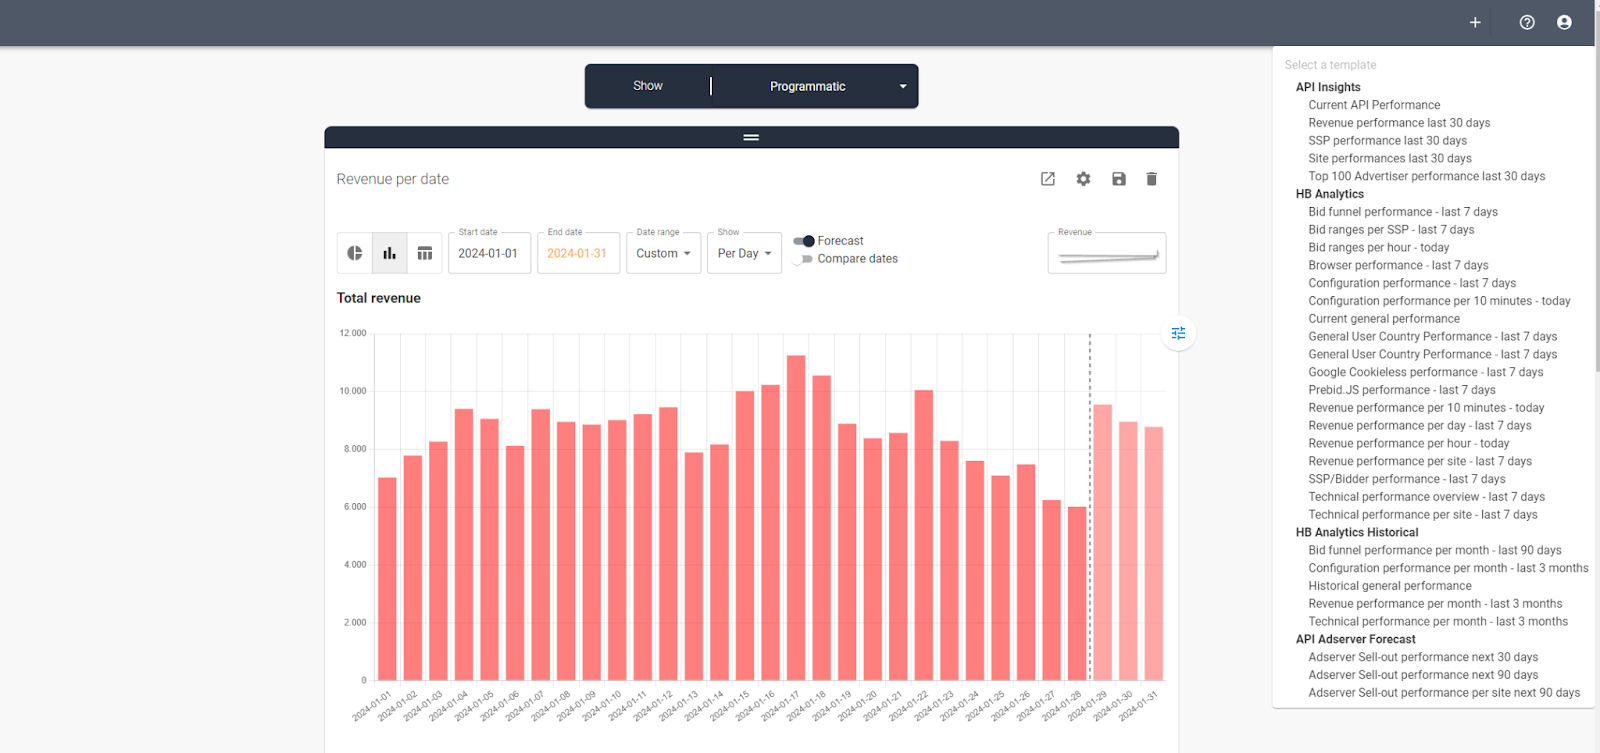
New templates will show up in the existing templates list:
You can read more about how to work with the template editor here.
What's in it for you?
The ability to produce templates for your admin team or your publisher/sales means you can help your co-workers/clients better. Quickly turn a report into a template that you can use in the dashboard or at a later time!
We have also added descriptive texts to all of the templates, making it easier for you to select what to use. You just need to hover the name of the template, and you will get a short description about it.
2. New set up official templates
We have added several new templates, and reworked the existing templates slightly. The new templates cover all of our new modules, and most of them are available either as a report template or a dashboard report module template. Templates that report data further than 2 months back are usually better to keep as a report, in order to make the dashboard load faster the first time each day that you enter Relevant Yield.
You can find the new templates either here (dashboard):
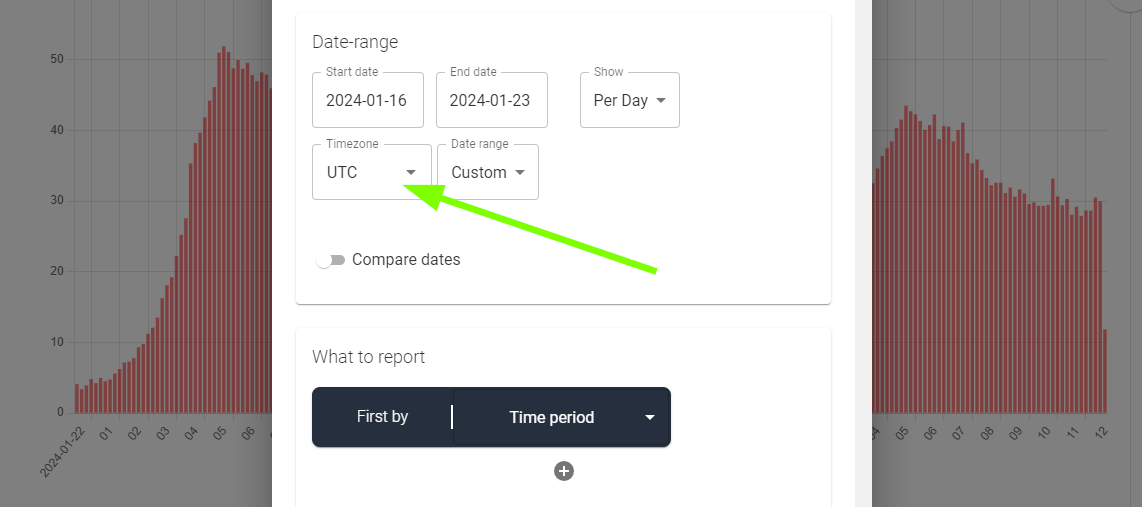
If you add a report or dashboard reporting module, from a template, you can of course edit it, and change anything you would like to.
An example could be to add the correct time zone you use:
What's in it for you?
An easier way to get usable information from the system and a better understanding of what the system can do for you.
We will continue to add new templates during the year when we add new metrics and functions, so stay tuned!
3. Dynamic metric order in tables
We have introduced a drag-and-drop function, so you can now change the order of your metrics. This means that if you want to change the order of your metrics, you can just create the report or dashboard reporting module and then rearrange it by dragging the metrics or graphs. Once you have done that, you can save the changes if you want them to remain.
What is in it for you?
A better option is to create a logical flow between the metrics when looking for something in particular. A good example of this could be the ”bid funnel” template, where we start with the incoming traffic and the initiation of the auction and then show metrics in the same order as the auction gets executed until it is concluded:
Naturally, you can, of course, use the ordering that makes most sense to you or an order that highlights what you would like to emphasise for a colleague - it is very flexible.
4. Last 3 months vs previous 3 months - a change!
We have added a new date range covering the current month + the 2 previous months. This will replace the “old” last 3 months; which covered the previously ended 3 months (so the current month was not included).
With the change, the new date ranges will work like this:
- Last 3 months (current + 2 previous months)
- Previous 3 months (the previous full 3 months)
What is in it for you?
More options on how you would like to see your data. If you are using dynamically changing date ranges, having something like the new last 3 months will give you a nice continuous development look. It is also used for a lot of the new templates.
5. Google Chrome cookie 1% deprecation - new dimension & template
As most of you probably know, Google is phasing out the ability to use cookies in Chrome. We have added a few good things in the tool to make it easy for you to evaluate and test the consequences on your website.
The new dimension is called “Chrome Cookie Disabled Group”, and it has 2 values:
- [empty] = normal traffic
- yes = where we were not allow to set the cookie
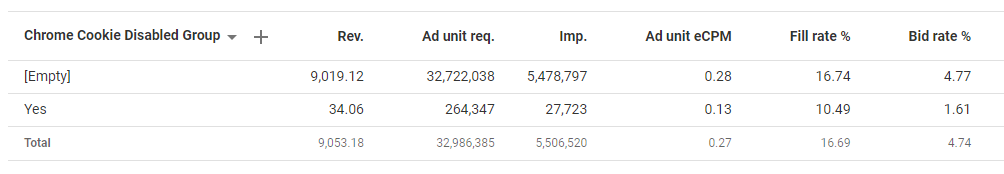
Initial findings show us that there is a drop of roughly 50%, but also that it varies a lot for different SSPs. The new dimension works fine with other dimensions and metrics, and we recommend that you at least investigate how your different SSPs are performing; but experimenting is always fun!
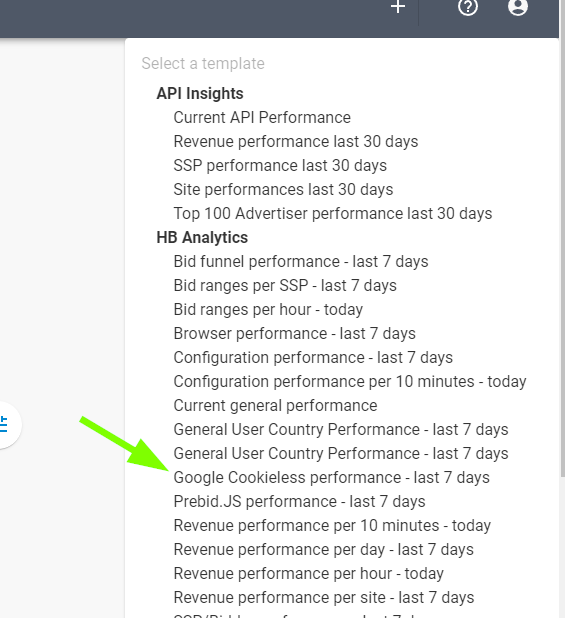
We have prepared a new basic template to make it all easier for you:
What is in it for you?
A way to prepare and see the consequences of the gradual phasing out of the cookie in Chrome.
- See what drops you have on your sites currently.
- Experiment with new ID solutions to see if you can improve the situation.
- See if first-party data can help improve the situation.
- Evaluate each SSP and see how they are preparing for the cookie-less environment.
- Monitor if the browser eCPMs are changing due to this.
- Initiate discussions with your SSPs at an early stage in order to see if something can be improved well in advance.
- Maybe investigate if your contextual data can be used in a good way.
What's next?
We will send you a monthly newsletter update on the new releases, so you are always well prepared, and can check out the new features right away. New releases can also always be found at our support portal here.
If you have any questions, feel free to reach out to me, the support or any other contact you might have, and we will help you out!