
The HB Analytics alarms can be accessed through the menu item ALARMS, and can be used to report in basically any metric available in HB Analytics. It is a really powerful tool, which make it possible to build your alarms in a completely customized way, based on what your day to day work is centered around.
When should I use Ad Revenue Insights' alarms and when should I use HB Analytics Alarms?
Well, it is dependent on what you want to cover really, as some of the metrics are specific for the different reporting types, but also (in the case of overlap), how fast you need your trigger to happen. It also depends on whether you are utilising both modules or only the HB Analytics module.
The data in Ad Revenue Insights are imported on a daily level, because some data is simply not complete/consolidated enough to base any proper analysis on. So any alarms built on the API data, will naturally also have one day delay. Now this is not critical at all when monitoring some levels, and it certainly provides good stable data over time, and more long-term alarm options; but for more technical alarms the HB Analytics alarms are to be preferred, as they trigger within the hour.
How do I set up an alarm in HB Analytics?
Start by clicking the Alarms menu item, and then open up the "Alarms" drop down for active alarms:
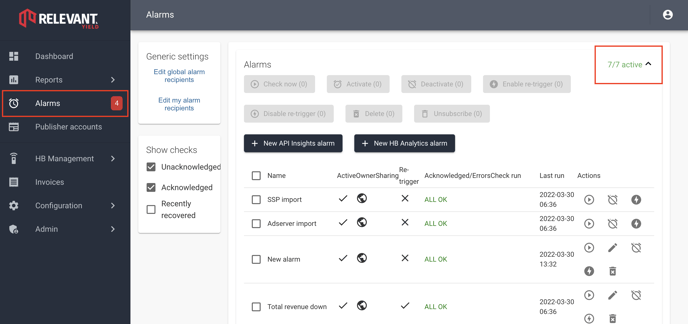
Here you can see and manage the existing alarms. In order to set up a new alarm, you can press the + New HB Analytics alarm button. You now have the option to start a "Custom alarm" set up, or select one of the presets. In this guide, we will focus on the custom report, as it covers the most options.
This will bring you to a screen that resembles the normal reporting screen. Setting up an alarm is actually very similar to how you pull a report, but there are a few unique things to think about:
- First, you give your alarm a name, if you share your alarm, this will also be the name other users will see.
- The dates work differently, so usually it is more about selecting a dynamic time period in the date-range; like "Per Day" - then the report will trigger on events that take a full day into consideration (or several, if you work with trend metrics). Please notice that HB Analytics works with real-time data, so we do suggest you use smaller time-periods; to really catch a potential error fast.
- Select what you would like to report on. Please notice that if you want to measure fx, "Revenue levels per bidder" and want to have a real value; then you should probably work with multiple alarms - one per bidder (if the trigger level should be different per bidder). You can also filter on the bidders you want to use.
- By using the "Compare date range", you can set % related fluctuations as triggers; which can be useful, when monitoring dimensions and metrics, which might have quite different levels, and where one fixed value is not so useful to use. Example: You work with 4 different bidders, with big differences of revenue. A compare date range, where you look at the % bidder per bidder will most likely make more sense, than if one bidder drops below an absolute value. A % drop from day to day per bidder might be more useful.
- Now you will see a report created based on your settings and the values that are present for your selection. On the right side of the configuration you can now see one or more "ALARM" buttons, the one furthest on the right is used for % changes (it is based on the compared date changes). The "ALARM" on the left, is used for real values. Press the alarm button you want to use, and you are presented with a Condition for your alarm trigger. Set a condition, fx "Less than" and then select a value, fx 1000 Euro. Press OK.
- You can now SAVE your alarms, and/or select if your alarm should be Private or viewable for others in your organisation. Press SAVE when you feel happy with your alarms (you can go back and edit later if you want to).
- Once saved, the new Alarm will show up in the list, with any potential triggers triggered (Errors). These errors can be acknowledged, for the current period if needed (as you are aware of them). The Alarm is now set and will trigger the next "period" if there is a new Error.
In the top-panel Alarms (collapsed by default) you'll see the Alarms created while the lower (main) part is the individual failures (and/or recoveries) of the alarms. That's what called checks. So one alarm can cause multiple checks to fail, for example, if there are 2 Bidders with too low %-revenue levels.

If there are multiple conditions AND-logic will be used between them - so that you, for example, can set up a "low-CPM" alarm but only trigger it when the number of ad-requests is above a certain threshold. It's not possible with OR-conditions as it's probably more intuitive to create different alarms instead - for example, create one Low revenue alarm + one High timeout % alarm instead of one Low revenue or high timeout %" alarm.
The Filter failures switch is useful in order to only see the failed (red) lines in the report.
For compare to metrics the logic is a bit different as seen below:

There are a couple of differences between the alarm reports compared to the normal reports:
- Forecasting can't be selected.
- All dates - Start, End and Compare to - are automatically converted to relative dates when saving as we don't want alarms that check the same time ranges all the time.
Description of Alarms panel
- Active - That the alarm is active means that it will run automatically, either after imports for programmatic alarms or by a time-schedule for HBA alarms. It's still possible to run the inactive alarms from this page manually.
- Private - If set the alarm is "private" and only visible to the current user.
- Acknowledged/Errors - How many checks are currently acknowledged/in total generated by the alarm.
- Check run - When manually running alarms here this column will update with "ok check-marks" or error-balloons there was an error running the alarm (not the same thing as if failures was generated by the alarm).
- Actions - Corresponds to the Action-buttons at the top of the list (used for "bulk-actions"). It also contains the Edit button (see later).
Description of checks panel
- Info - Description of the failed object. For example "blurredpublisher.com >> Rubicon" in the screenshot above means that we've created a report-alarm with dimensions Publisher and SSP and in this case the report-line for that Publisher/SSP has failed the alarm condition.
- Alarm - Name of the alarm
- Status - Shows if the alarm is failed and not acknowledged (red balloon), failed and acknowledged (orange) or recovered (green).
- Check run - Same as Check run for the alarms.
- Date - Date of last check, clicking the link will show a popup with "recent history" of the check. This will include times when the status has changed between failed/recovered along with the latest check.
- Actions - Corresponds to the Action-buttons at the top of the list (used for "bulk-actions"). It also contains the View report buttons that will show a report with the same settings that were used when doing the check. The report itself is not saved, just the settings, so it's not certain the check is in the same state when viewing it.
Other settings
- Generic settings >> Edit global alarm recipients - Mail address(es) to recipients of the global (non-private) alarms.
- Generic settings >> Edit my alarm recipients - Mail address(es) to the current user's private alarms.
- Show checks >> Unacknowledged - Show unacknowledged errors
- Show checks >> Acknowledged - Show acknowledged checks
- Show checks >> Recently recovered - Show that have recovered the last 7 days.